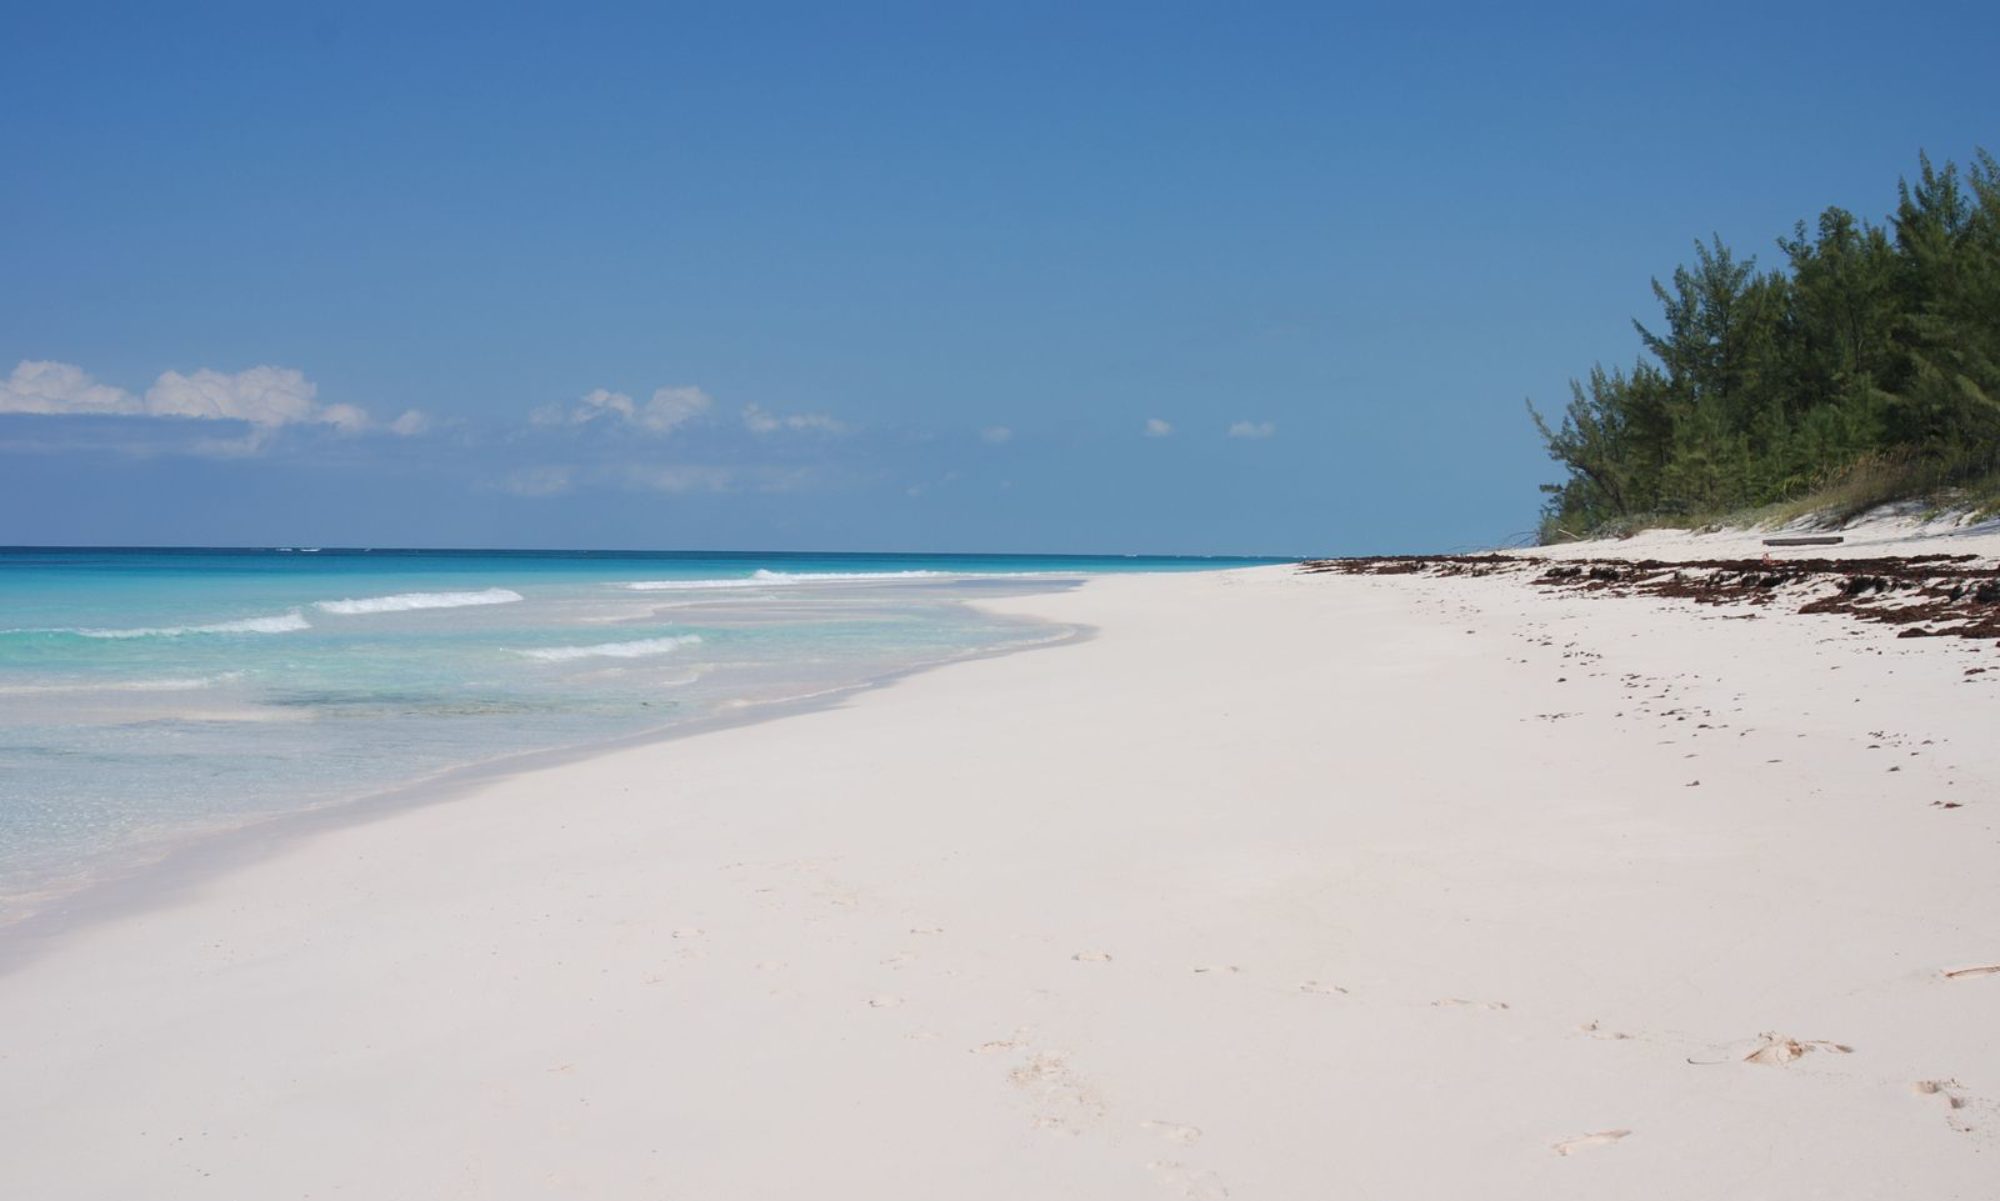
One of the top questions we get asked is When is the BEST time to visit the island? Well, we think Eleuthera is always better than practically anyplace else on Earth, but see the information below to help you plan your trip.
And just remember…Climate is what to expect year after year…but WEATHER is what is happening outside right now!

Handy Tip: Don’t freak out about a chance for rain…pop-up showers often happen in the afternoon for 30 minutes or so and then move off…if it is raining where you are head North or South and you’ll find the sunshine. In our years of going to Eleuthera during all different times of year, there has only been 1 day where the rain didn’t let up…we stayed on a covered porch, read books and played cards…still a pretty darn good day.
Eleuthera Climate – Month by Month
January: The first two weeks are still warm and pleasant for swimming. Later on air temperatures drop and the sea can be a bit rough.
February: The first half is usually much like the second half of January. In the second half of February air temperatures start to rise.
March: Getting warmer and winds dying down unless a cold front passes.
April: Dry and warm.
May: Water warming up. Still little rainfall.
June: Humidity and temperature considerably higher as rainy season is starting with short pop-up showers.
July: Air temperatures still rising slightly. Water temperatures are about 91°F/33°C.
August: About as hot as July. Calm apart from some thunder storms.
September: Very much like August. But highest probability of hurricanes.
October: The Bahamas climate’s worst month. Highest rainfall of the year. Rain can last for over a day.
November: Considerably less rain and slight drop in temperature. Probability of hurricanes is very low even though the official hurricane season does not end until Nov. 30.
December: Little rain. Air and water temperatures decreasing. Generally very pleasant weather, with occasional hot days.
Here’s a little more about what you can expect:

Water Temperature
You’ll notice how warm the water is even in winter. A local made these measurements himself because official sources gave low temperatures that were at odds with his own experience. So he created the table based on actual measurements taken near shore, where people swim. The official measurements were probably based on satellite data taken far from shore where no one will swim or snorkel anyway.


